Timesheets: Variance Analysis & Labor Compliance
In a professional services or corporate PMO environment, a timesheet is not just a record of hours worked—it is a Performance Metric. When you compare "Actuals" (what was logged) against a "Baseline" (what was promised), you uncover the truth about your project's health.
MSP Planner transforms Jira worklogs into a Variance Analysis engine, allowing you to spot over-utilization, under-reporting, and budget leakage in real-time.
The Two Pillars of Labor Analysis
Professional labor governance requires two different perspectives: the Resource Perspective (Team View) and the Commitment Perspective (Project View).
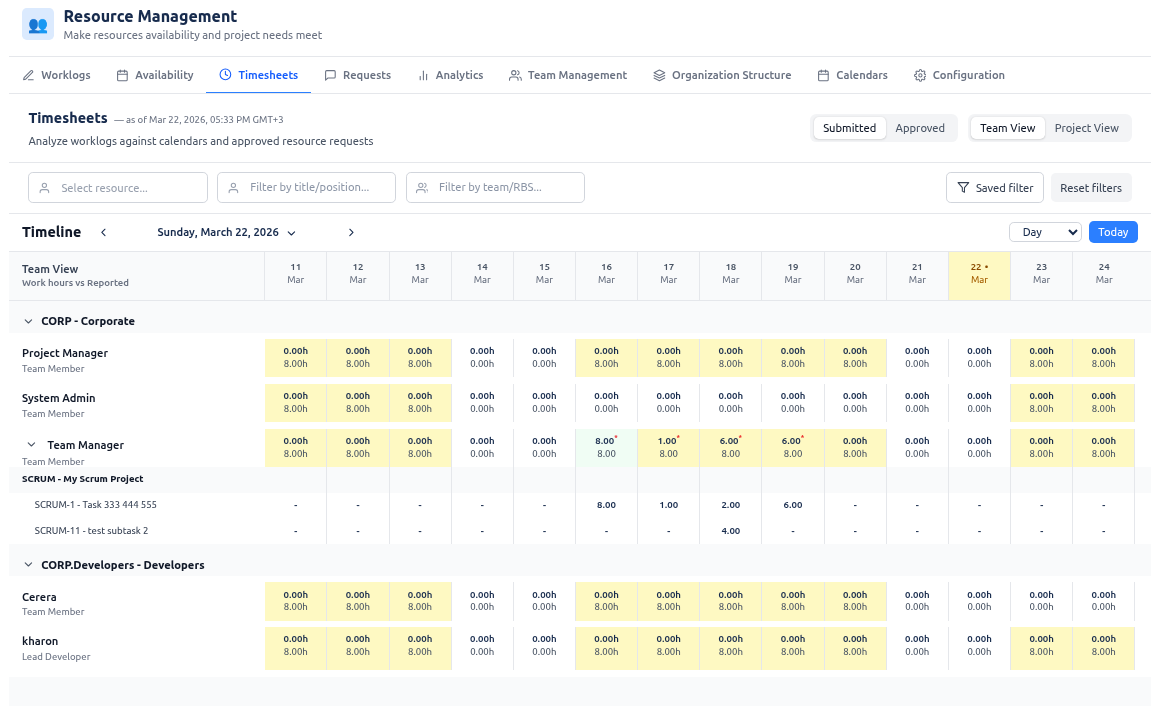
1. The Resource Perspective (Team View)
Focus: Capacity Health & Burnout Prevention In Team View, the baseline is the Available Working Time derived from the resource's effective calendar.
- Under-reporting (Yellow): A resource is logging fewer hours than their capacity. This may indicate a lack of work, inefficiency, or "shadow work" not being captured in Jira.
- Over-reporting (Orange/Red): A resource is logging more hours than their calendar allows. This is a critical signal for burnout risk and a failure in capacity planning.
2. The Commitment Perspective (Project View)
Focus: Budget Integrity & Fulfillment In Project View, the baseline is the Allocated Hours from approved Resource Requests.
- Under-fulfillment (Yellow): The project is not receiving the level of effort promised. This is a leading indicator of deadline slippage.
- Budget Leakage (Orange/Red): More hours are being spent than allocated. This indicates scope creep or technical debt that is consuming the project's budget.
Practitioner's Perspective: Enterprise Labor Governance
Experienced PMO leads use timesheets to enforce a "Culture of Accountability" through three advanced mechanisms:
🛡️ The Approval Workflow (Compliance)
By enabling Worklog Approvals, you move from "Passive Tracking" to "Active Governance."
- ** Submitted vs. Approved**: The system distinguishes between what a developer claims they did and what a manager validates.
- Audit Trail: The transition from
submittedtoapprovedcreates a legal record of labor, essential for external audits and client billing.
⚖️ Overtime Governance
Overtime is often a "hidden" cost that kills project margins. MSP Planner isolates overtime in purple indicators, allowing you to see exactly where "Hero Culture" is replacing sustainable planning. If you see consistent purple markers on a specific project, you have a staffing failure, not a performance success.
📉 The "Invoicing Truth"
The Download Invoice feature transforms raw Jira data into a financial document. By integrating Jira Saved Filters, you can isolate specific workstreams (e.g., "Development" vs. "Consulting") to generate precise, audit-ready billing reports that map directly to the project's financial baselines.
Operational Guide: Using the Variance Grid
The grid is a heatmap of project health. Instead of reading numbers, look for Color Patterns:
| Color | Meaning | Management Action |
|---|---|---|
| Green | Balanced | Maintain current allocation. |
| Yellow | Under-utilized | Investigate if the resource is blocked or if the task was overestimated. |
| Orange/Red | Over-loaded | Trigger an immediate "Resource Rebalance" or adjust the project deadline. |
| Purple | Overtime | Analyze the cause of the surge. Is it a one-time spike or a systemic under-estimation? |
Pro Tip: The "Asterisk" Warning
When the Submitted vs. Approved switch is active, an asterisk (∗) appears on cells where a gap exists. This is your "To-Do" list for the end of the week: any cell with an asterisk represents a pending decision that is delaying your financial reporting.
Summary for PMOs
| Analysis Type | Baseline Used | Primary Goal | Business Outcome |
|---|---|---|---|
| Team View | Effective Calendar | Resource Sustainability | Prevent Burnout & Churn |
| Project View | Approved Requests | Budget Adherence | Prevent Cost Overruns |
| Approval Flow | Managerial Review | Labor Compliance | Audit-Ready Billing |