Capacity Planning & Resource Load
The ultimate goal of resource management is to ensure that your plan is achievable. A schedule that looks great on a Gantt chart but requires a single developer to work 80 hours a week is not a plan—it's a wish.
MSP Planner provides a data-driven approach to capacity planning using Resource Histograms and Load Analysis.
Understanding the Resource Histogram
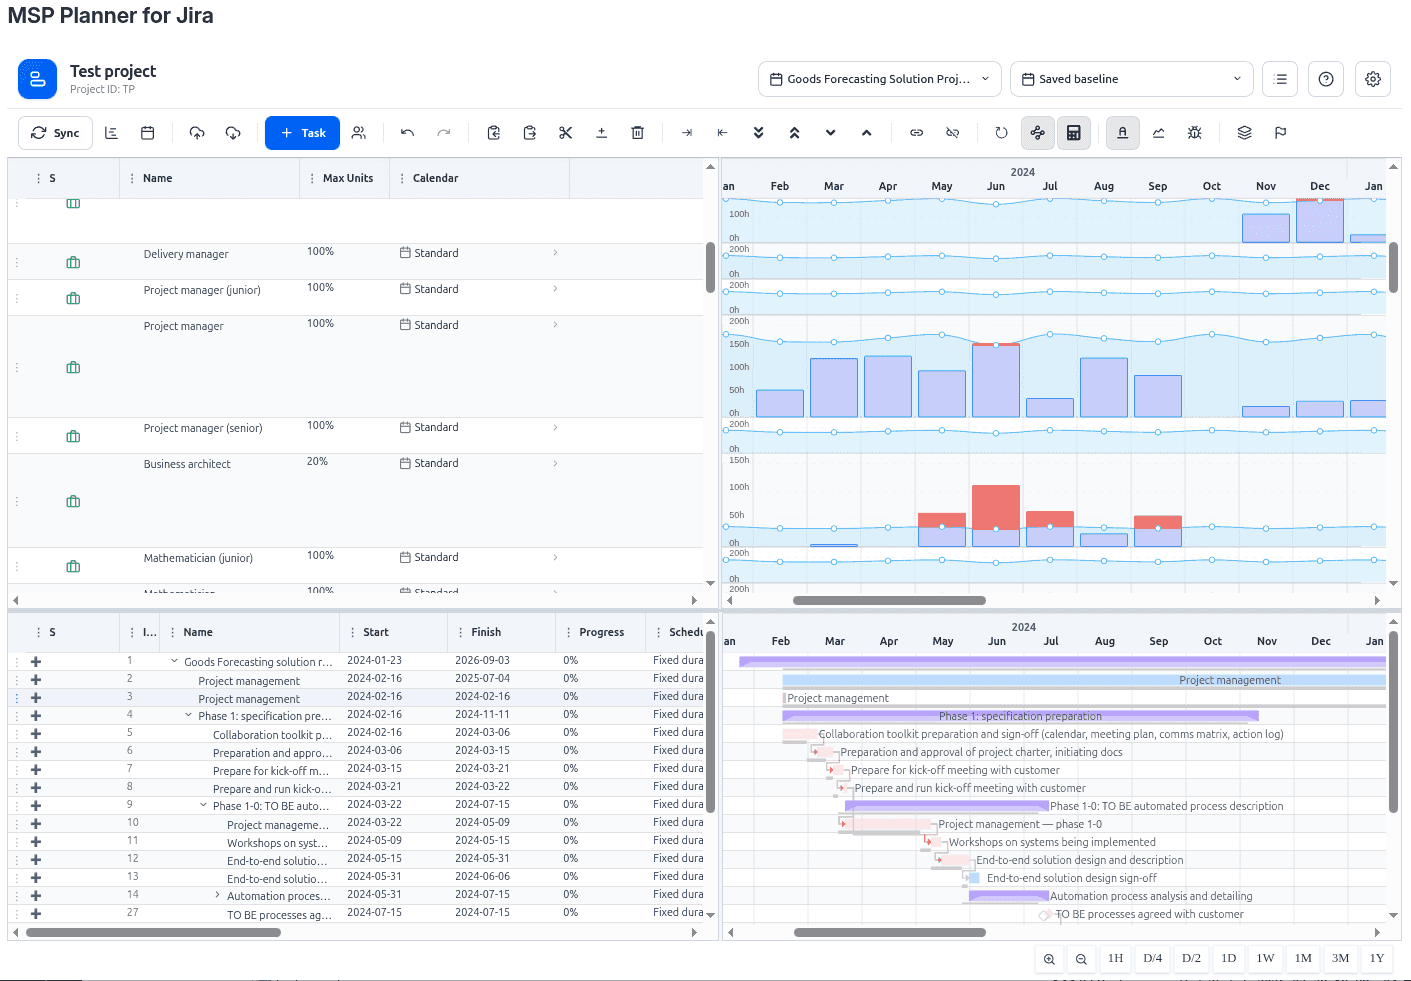
The resource pane provides a visual representation of the "Load" for every resource over time, based on Canonical Period Metrics:
- Availability (The Capacity Line): The maximum available hours for a resource in a given period. This is calculated using the resource's assigned calendar and their
Maximum Unitssetting (e.g., a resource at 50% capacity has half the availability of a 100% resource). - Utilized Hours (The Load Bars): The actual hours assigned to the resource across all their tasks for that period.
- Remaining Hours (The Gap): The difference between Availability and Utilization.
- The "Red Zone" (Over-allocation): When Utilized Hours exceed Availability, the bar is highlighted in red. This is an immediate signal that the resource is over-allocated.
The Capacity Planning Workflow
To move from an "over-allocated" schedule to a "realistic" one, use the following workflow:
1. Detect the Bottleneck
Scan the resource histograms for red zones. Identify which resource is the bottleneck and during which time period the over-allocation occurs.
2. Analyze the Cause
Use the Split-Pane Filtering to select the over-allocated resource. The Timeline (top pane) will now show only the tasks assigned to that person. Identify which tasks are overlapping or which task has an unrealistic amount of work.
3. Resolve the Conflict (The Strategic Matrix)
Depending on the task's priority and its impact on the project finish date, choose the most appropriate resolution strategy:
| Strategy | When to Use | Scheduling Logic | Governance Impact |
|---|---|---|---|
| Shift | The task has high Float (Slack). | Move the task to a period of lower utilization. | Zero Impact: The project finish date remains unchanged. |
| Reallocate | The task is Critical, but a similar resource is available. | Change the resource assignment to someone with spare capacity. | Neutral: Maintains the critical path while resolving the bottleneck. |
| Stretch | The task is Critical, and no other resources are available. | Use Fixed Work mode: increase duration while decreasing units (e.g., 100% for 2 days $\rightarrow$ 50% for 4 days). | Negative Impact: Pushes the critical path and delays the project finish date. |
Strategic Load Management
Professional capacity planning requires looking beyond the "Red Zone" to ensure long-term project stability.
Sustainable Pace vs. Theoretical Maximum
While the histogram shows 100% allocation as the limit, a professional PM avoids "maxing out" resources.
- The 80% Rule: Aim for a sustainable load of 80%. This provides a "Strategic Buffer" to absorb the inevitable "micro-slips," unplanned meetings, or emergency bug fixes without immediately triggering a critical path delay.
- Burnout Risk: Consistent 100% allocation over several months is a leading indicator of quality drops and attrition.
Triple-Point Capacity Analysis
Capacity planning is the operational side of the "Triple-Point" governance model (Baseline $\rightarrow$ Planned $\rightarrow$ Actuals):
- Planned vs. Baseline: If the capacity needed to hit the baseline has increased, you have a Planning Variance.
- Actuals vs. Planned: If resources are consistently posting more hours than the capacity plan allows, you have an Execution Variance.
- The Feedback Loop: Use this data to adjust your Scheduling Modes. For example, if a task consistently "burns" more work than planned, switch it to Fixed Work and stretch the duration to reflect the factual effort.
Related guide: Capacity Planning in Jira — how to plan against real availability instead of the 40-hour myth.