Resource Management
A realistic schedule depends on knowing exactly who is available and when. MSP Planner provides a professional resource management system that distinguishes between organizational directory resources and local project resources, allowing you to plan against real capacity rather than theoretical maximums.
1. The Resource Pool: Origin & Identity
MSP Planner recognizes that resources originate from different sources. To maintain data integrity, the app uses three distinct classifications, visually identified in the resource pane by an origin icon:
Organization/Directory Resources (Amber Icon 🟠)
These are system resources linked to your organization's directory or the Jira user database.
- Identity: They carry a stable platform identity (e.g., Jira
accountId). - Governance: Their master data (Name, Email) is read-only in the timeline. However, depending on your project settings, you may be able to override their Project Calendar or Max Units for the specific needs of your schedule.
- Linkage: When you add a system resource, any worklogs posted by that user in Jira are automatically aggregated as "Actual Work."
Actuals-Reconciled Resources (Violet Icon 🟣)
These are system identities that exist in your schedule primarily to reconcile posted worklogs from the host.
- Purpose: They represent "silent contributors"—users who have posted time against your project in Jira but haven't been explicitly added to your planning pool.
- Behavior: They ensure your "Actuals" are accurate and your project progress is factual without cluttering your planning pool with every single person who ever touched a ticket.
Project Resources (Emerald Icon 🟢)
These are local resources created specifically for the current schedule.
- Use Case: Use these for external consultants, subcontractors, or "placeholder" roles (e.g., "Lead Designer") before a specific person is assigned.
- Governance: These are fully editable within the timeline.
2. Capacity Governance: The Math of Availability
To prevent over-allocation, MSP Planner calculates availability based on two primary drivers: Max Units and Tiered Calendars.
Maximum Units (Base Capacity)
Every resource has a Maximum Units setting (e.g., 100% for full-time, 50% for part-time). This defines the baseline capacity of the resource.
- Calculation: If a resource is set to 50% capacity, their available hours in the histogram are halved compared to a 100% resource.
- Governance: This ensures that "Available Hours" are realistic and based on the actual contract of the resource.
Calendar Alignment
Availability is not just a percentage; it is bound by time. MSP Planner uses a Multi-Tier Calendar Model to determine when a resource can actually work:
- Project Calendar: The global working time for the project.
- Resource Calendar: The specific working pattern of the individual (e.g., a 4-day work week).
- Personal Availability: Specific exceptions like holidays or vacations.
For a deeper dive into how these tiers interact, see Multi-Tier Calendars.
3. The Assignment Model
Assignments are the bridge between your tasks and your people.
Allocation Units
When assigning a resource to a task, you specify the Units (percentage of their time).
- Example: Assigning a resource at 50% means they spend half of their working day on that specific task.
- Interaction: Depending on your Scheduling Mode, changing these units will either shift the task's duration or update the total work required.
Interpreting the Resource Histogram
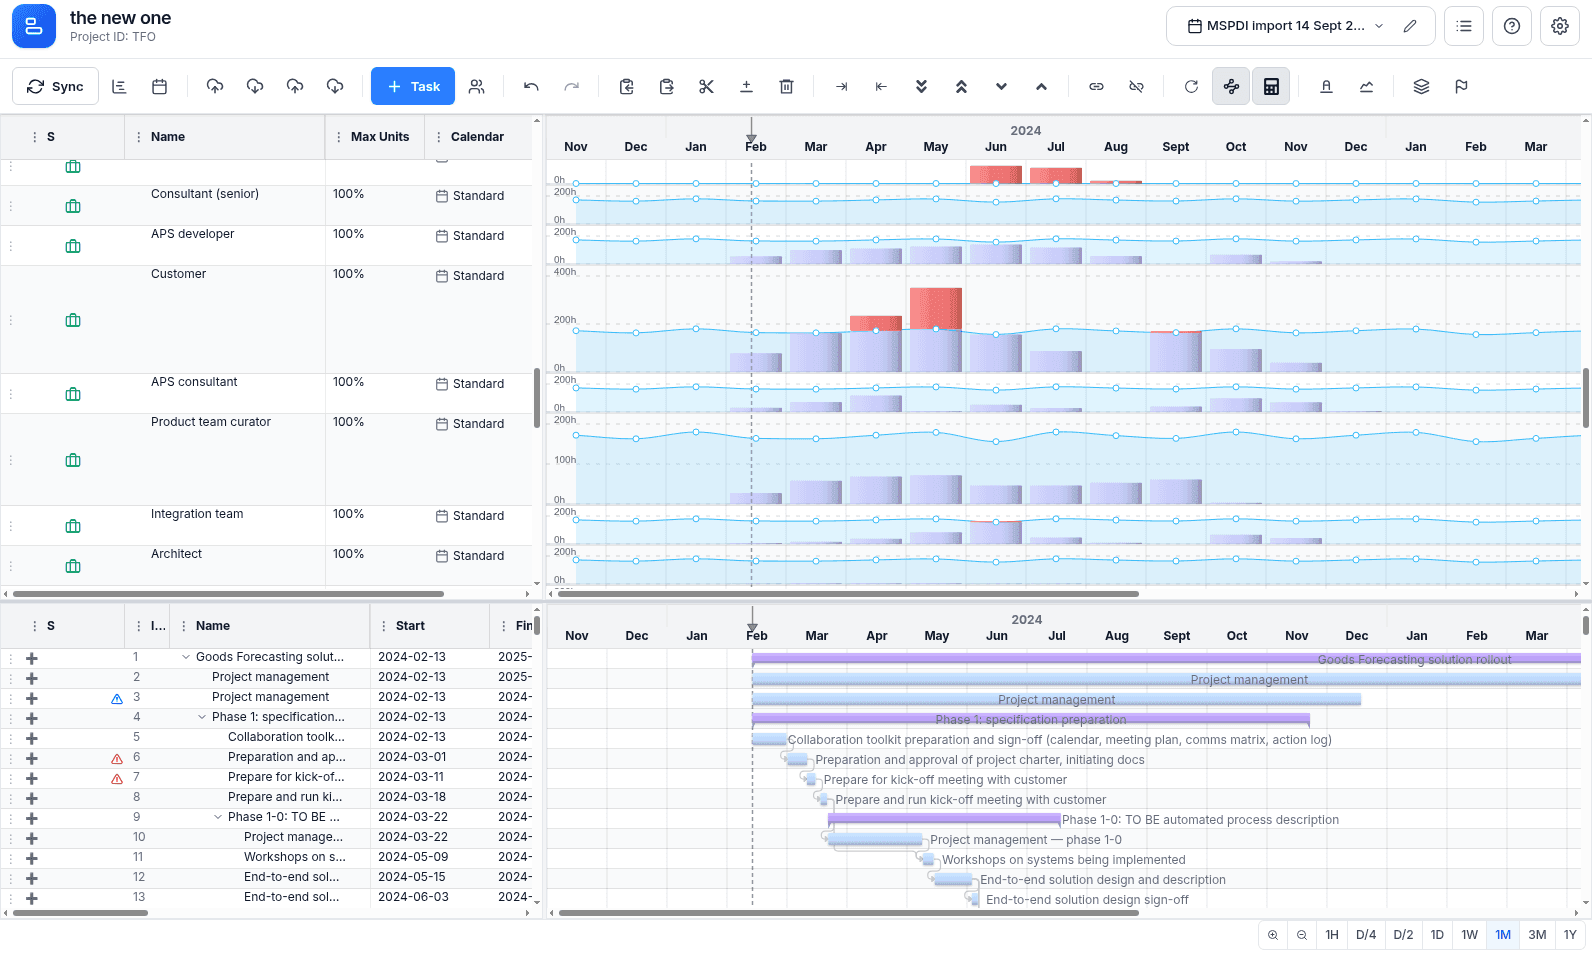
The resource pane provides a visual representation of the "Load" over time:
- Availability Line: The maximum available hours based on the resource's Max Units and Calendars.
- Utilized Hours (The Bars): The sum of all assigned units across the resource's tasks.
- The "Red Zone": When Utilized Hours exceed Availability, the bar is highlighted in red. This is an immediate signal of over-allocation.
4. Execution Tracking: The Actuals Link
A professional plan must be compared against reality. MSP Planner bridges the gap between "Planned" and "Actual" effort.
By aggregating posted Jira worklogs, the tool overlays Actual Work directly onto the resource view. This allows you to:
- Identify the Reality Gap: See where resources are spending more time than planned.
- Fact-Based Re-planning: Use actual utilization data to adjust your future estimates and resource allocations.
For a detailed guide on this process, see Tracking Execution with Actuals.
Managing Your Resources
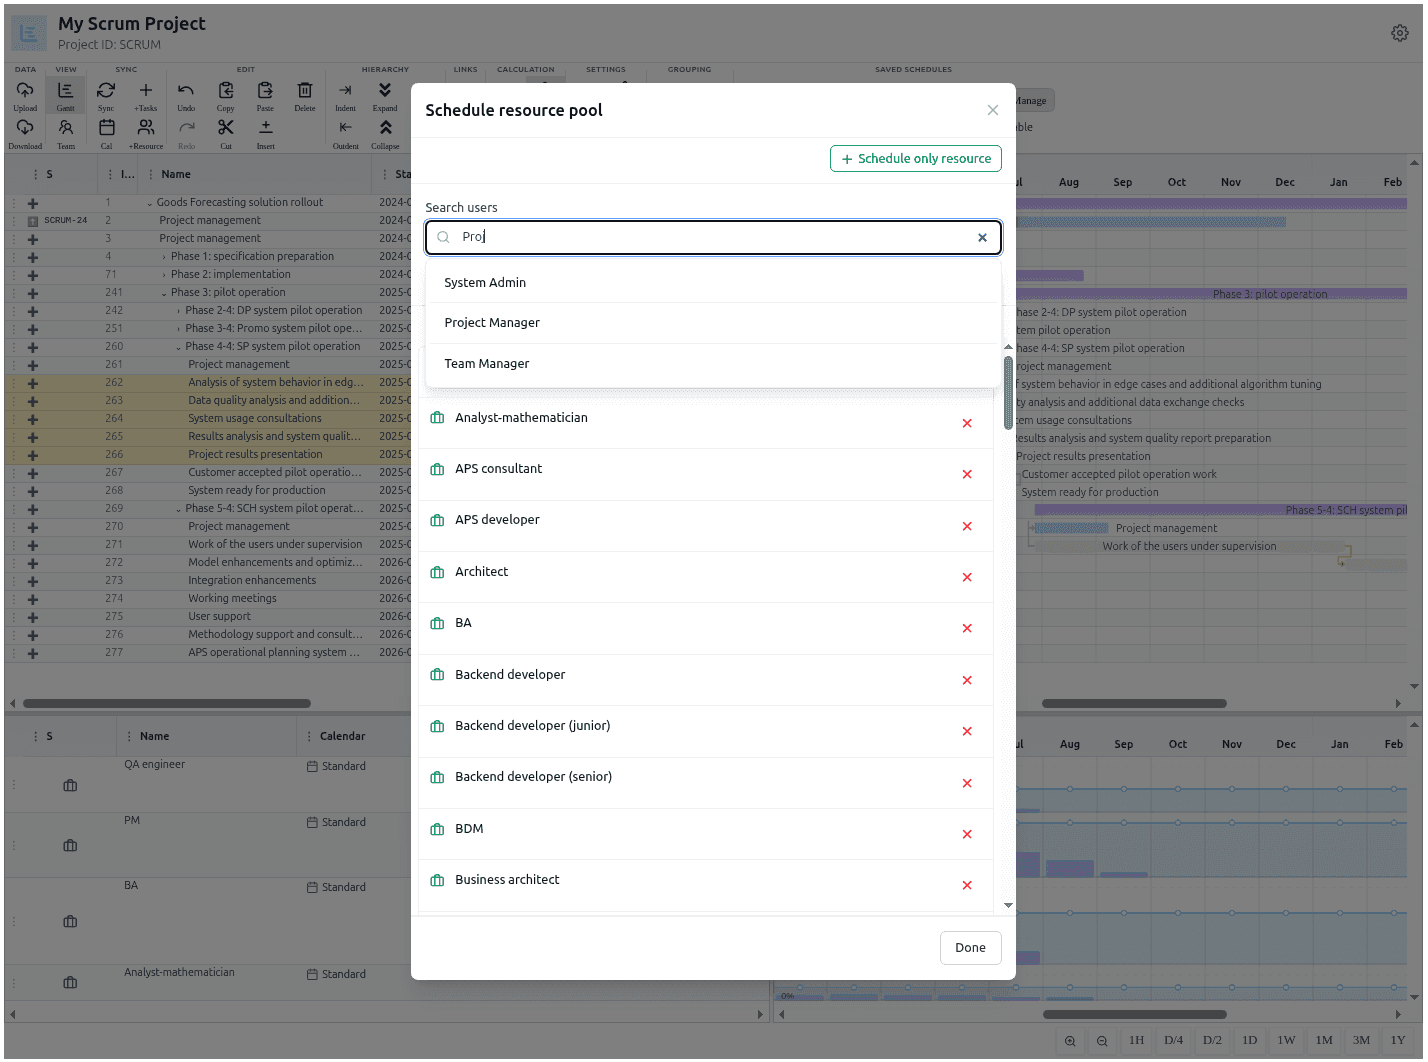
Adding and Creating Resources
You can populate your resource pool using the Add Resources control in the toolbar:
- Search & Attach: Search the corporate directory to attach existing Jira users.
- Quick Create: Use the inline "Create" pattern to add a project-local resource instantly.
Organizing the Pool
- Drag-and-Drop: Rearrange the order of resources in the resource pane to group them by team or seniority.
- Filter by Selection: Use "Team Mode" in the resource pane to isolate specific resources and see only the tasks they are assigned to.